

If you resell LEGO minifigures, the data you track matters more than whatever spreadsheet or app you happen to use. The core fields are simple: catalog ID or SKU, figure name, theme, release year, condition, acquisition cost, the platform you listed on, your asking price, and what the figure actually sold for. Track those nine fields consistently and you will start to see which figures move fast, which ones sit for months, and where your real margin is coming from.
I've built brick'em around this exact problem. In my experience, resellers rarely lose money because they don't know LEGO. They lose money because they can't see their own numbers. I personally can tell you a hundred minifigure values off the top of my head, but the sellers who actually scale are the ones who also know their average sell time on BrickLink versus Whatnot, and which platform is quietly eating their margin in fees.
Key takeaways:
- Track at least nine core fields per figure: SKU, name, theme, year, condition, cost, platform, list price, and sold price
- Condition and completeness change resale value more than most new sellers admit
- Platform level data across BrickLink, eBay, Whatnot, and Facebook Marketplace tells you where to list, not just what to list
- Raw data only helps if you review it on a schedule and actually act on what it shows you
What Core Fields Belong in a LEGO Minifigure Spreadsheet or App?
The core fields are catalog ID or SKU, figure name, theme, release year, condition grade, acquisition cost, sourcing channel, platform listed, asking price, sold price, and date sold. Eleven fields sounds like a lot, but together they are enough to calculate margin, sell through time, and platform performance without turning inventory work into a second unpaid job.
When I sort through a new lot, I don't try to catalog everything about a figure. I stick to the fields that actually change a decision. Here is the checklist I recommend starting with:
- SKU or catalog ID: lets you match a figure to its exact official listing instead of guessing from memory
- Figure name and theme: Star Wars, Marvel, Ninjago, City, and so on, since theme drives liquidity more than almost anything else
- Release year: helps you spot retired or vintage figures that collectors chase
- Condition grade: mint, good, used, or damaged, since this alone can swing price by a wide margin
- Acquisition cost: what you actually paid, including your share of a bulk lot
- Sourcing channel: Facebook Marketplace, a bulk lot, a convention table, and so on
- Platform listed: BrickLink, eBay, Whatnot, or elsewhere
- Asking price and sold price: the gap between these two numbers tells you more than either number alone
- Date listed and date sold: gives you sell through speed per platform and per theme
Why Does Condition Tracking Matter So Much for Minifigure Resale?
Condition matters because buyers are paying for a specific, often tiny, piece of plastic that connects to a character they care about, and any flaw breaks that connection. A mint Luke Skywalker figure and a used one with scuffed paint are not the same product to a serious collector, even though they are the same catalog item.
I noticed this early on. A figure that looks fine to a casual seller can have faded paint, a cracked torso clip, or a missing accessory that a collector will catch in two seconds on a live Whatnot stream. I personally grade every figure into one of four buckets before it ever gets listed: mint, good, used, and damaged. That one field, tracked consistently, explains more of your price variance than theme or year usually does.
Rarity compounds this. A handful of rare minifigures, something only about two thirds the size of an index finger, have sold for $2,000 to $3,000 in the secondary market. That kind of swing is exactly why condition and completeness data cannot be an afterthought once a figure has any real collector demand behind it.
How Should You Track Sourcing and Acquisition Cost Per Figure?
Track sourcing by recording where a figure came from and what it cost you on a per unit basis, even when it arrived inside a bulk lot. Without a per unit cost, you cannot calculate real margin, and without a sourcing channel field, you cannot tell which buying habits are actually making you money.
Bulk lots are where this gets messy. A seller I know buys mixed LEGO lots off Facebook Marketplace almost every weekend, and the only reason that business works is that he splits the lot cost across every figure and part before he lists anything. If you buy a 200 figure lot for $300, that is $1.50 per figure as a baseline cost, before you even start separating out the handful of figures that are worth $20, $40, or more on their own.
Before I buy a lot like that, I run the numbers through brick'em's haul calculator so I know roughly what the lot is worth before I hand over cash. It takes the guesswork out of a decision you otherwise have to make standing in someone's garage.
What Pricing Data Should You Record Before and After a Sale?
Record your asking price, your final sold price, the platform, and the date for every sale, then compare that against current market data at least once a month. Asking price tells you how you perceive a figure's value. Sold price tells you what the market actually agreed to pay, and the gap between the two is where most sellers find their pricing mistakes.
BrickLink is the closest thing LEGO resale has to a stock ticker. A lot of sellers I know treat it as the Wall Street of LEGO because its pricing data is detailed enough to show historical sold prices down to individual condition grades, which makes it the first place I check before I set an asking price on anything with real value. I cross reference new pickups against brick'em's minifigure database so I'm not relying purely on memory or gut feel.
Heads up: This is not financial or legal advice. We're sharing what we've learned from the LEGO reselling community.
If you're treating a collection as a long term investment rather than quick flips, it helps to see your full portfolio in one place. I run mine through the collection value calculator every so often just to see how the total is trending, separate from any single sale.
How Do You Track Platform Performance Across BrickLink, eBay, and Whatnot?
Track platform performance by logging which platform a figure sold on, how long it took to sell, and your effective fee after any promotion costs, then compare those numbers across platforms every month. Without that comparison, you are guessing at where to spend your listing time.
Here is roughly how I'd describe each platform's profile based on what I track and what sellers I talk to report:
| Platform | Best For | Fee Reality | Data to Track There |
|---|---|---|---|
| BrickLink | Individual parts, accurate pricing, low dollar items | Generally cheaper selling fees than marketplaces built for live or broad reach | Sold price history by condition, part completeness |
| eBay | Broad buyer reach, fast sales on underpriced items | Promoted listings can push total take rate close to 25 percent of the sale | Promotion spend per item, days to sell |
| Whatnot | Live selling, loyal fan categories like Star Wars and Ninjago | Has run no seller fee days, plus optional boosted promotion spend per show | Followers, show attendance, boost spend per show |
| Facebook Marketplace | Local sourcing more than selling | No platform selling fees | Travel time, haggling outcome, safety of meetup location |
My first Whatnot show only pulled about 10 viewers, and it still did over $500 in sales, which felt like a big deal at the time. I kept tracking show level data after that: followers, average viewers, and sales per show. Five months later I had crossed 3,000 followers and $30,000 in total sales, and I never once showed my face on camera. None of that growth would have been visible to me without tracking it show by show.
Should You Track Completeness and Missing Parts Data Too?
Yes. Track whether a figure or set is complete, and if not, which exact parts are missing, because incomplete inventory is fixable inventory, not junk, and it needs its own data field so it does not get buried in your general stock.
From what I've seen, a huge amount of used LEGO that people want to get rid of is missing at least one piece. Instead of writing those sets off, I log the missing part and shop for it on BrickLink, since that marketplace is built specifically for finding individual parts, accessories, and loose figures at the piece level. I started treating incomplete sets as a separate inventory category entirely, and it changed how much of my stock I was willing to buy in the first place.
How Do You Turn This Data Into Weekly Reseller Decisions?
Turn the data into decisions by reviewing it on a fixed weekly schedule and asking three questions every time: what sold fastest, what is sitting the longest, and what platform produced the best margin after fees. Data that nobody reviews is just a bigger spreadsheet, not a better business.
My weekly checklist looks something like this:
- Pull every sale from the last seven days and record sold price, platform, and days listed
- Flag any figure that has been listed for more than 30 days without a sale
- Compare average margin by platform, not just by figure
- Reprice or relist anything that is sitting, instead of letting it quietly tie up cash
- Note which sourcing channel produced your best margin this week
I recommend doing this on the same day every week, even if it's only 20 minutes. In my experience, the sellers who skip this step are the ones who end up with boxes of figures they forgot they even owned.
What Tools Make Minifigure Data Tracking Realistic at Scale?
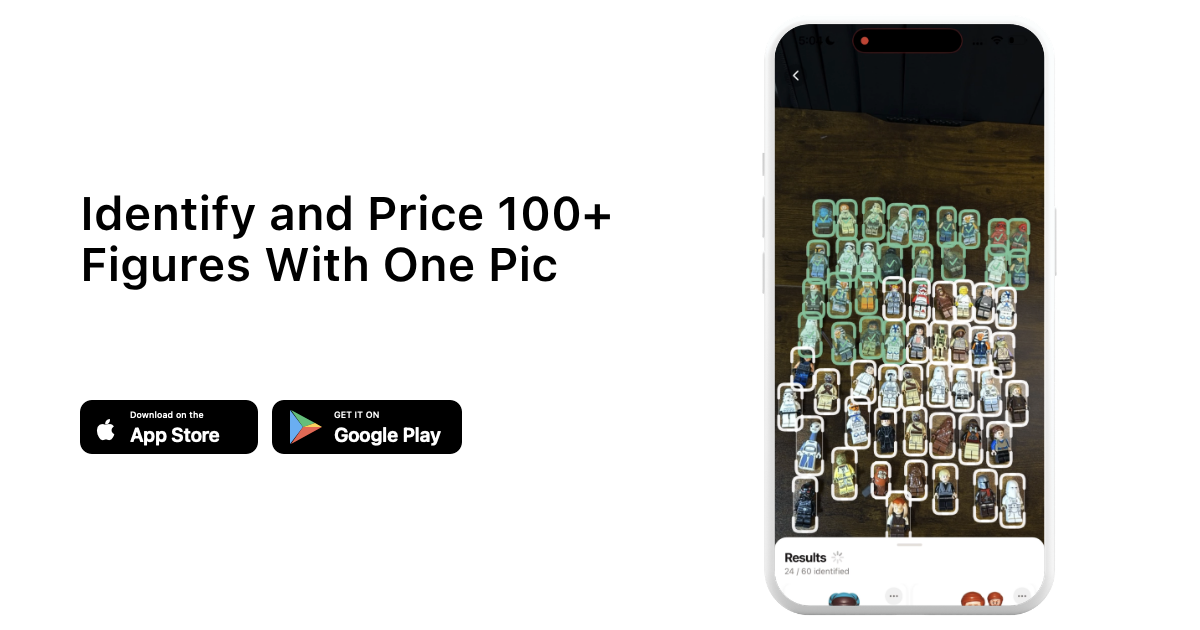
The tools that make this realistic are ones that let you capture data at the point of sourcing, not after the fact, since nobody actually logs 200 figures into a spreadsheet by hand after a long buying day. Bulk scanning and identification tools exist specifically to close that gap.
This is the exact problem I built brick'em to solve. When I'm sorting a big lot, I use the bulk scanning workflow to identify figures and pull pricing in one pass, rather than looking each one up individually. That single change is what made tracking the eleven fields above actually sustainable instead of something I only did for the first week after buying new software.
Frequently Asked Questions
What is the minimum data I need to track as a beginner LEGO minifigure reseller?
At minimum, track figure name, condition, acquisition cost, platform listed, and sold price. That five field version still tells you whether you're actually profitable and which platform is working, even if you skip theme, year, and sourcing channel until your volume grows large enough to need them.
Should I track minifigure data in a spreadsheet or an app?
Either works if you use it consistently. A spreadsheet is fine at low volume, but once you're sourcing bulk lots regularly, an app that scans and identifies figures saves enough time that it pays for itself, since manual entry is usually the real reason sellers stop tracking data at all.
How often should I review my minifigure inventory data?
Weekly is the minimum I'd recommend. A lot of sellers I know only look at their numbers monthly or not at all, and by then it's too late to reprice something that's been sitting for six weeks or to notice a platform quietly eating their margin in fees.
Does tracking this data really improve profit margins?
It does, mainly by showing you where money is leaking rather than by magically increasing prices. Most margin loss I've seen comes from stale listings, wrong platform choices, or underpriced bulk lots, and all three show up clearly once you're actually tracking sell time, platform, and cost per figure.
What is the biggest mistake resellers make with minifigure data?
The biggest mistake is tracking everything except cost. Sellers log what a figure sold for but not what they paid, including their share of a bulk lot, which makes it impossible to know your real margin. Cost per figure is the one field I'd never skip, even when I'm in a hurry.